close all; clear; clc; M = 10; N = 10; data = rand(M,N); % 生成M组N点演示数据 color = [000 001 010 011 100 101 110 111 0.50 0.75.75 ] ; % 自定义M组颜色 figure(1); hold on; % 在同一张图上绘制 fori = 1 : M plot(data(i,:),'color',color(i,:)); pause(0.5); % 暂停0.5s end
对于上面的color,你也可以使用系统定义好的colormap ,基本命令:
1
color = colormap(jet(M)); % M 是你要用的颜色数量
具体实例:
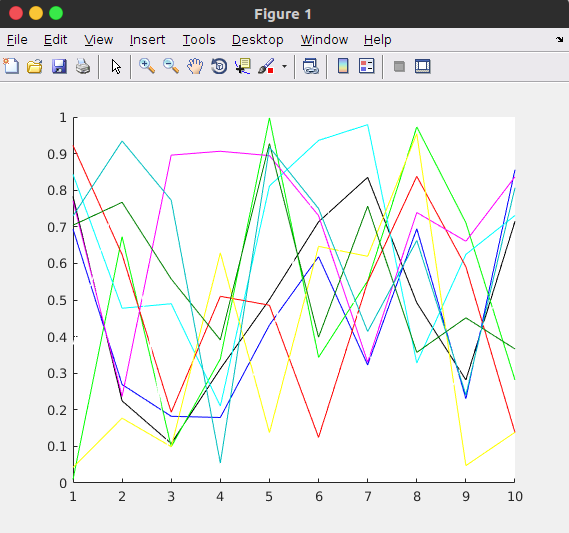
1 2 3 4 5 6 7 8 9 10 11 12 13
close all; clear; clc; M = 10; N = 10; data = rand(M,N); % 生成M组N点演示数据 color = colormap(jet(M)); figure(1); hold on; % 在同一张图上绘制 fori = 1 : M plot(data(i,:),'color',color(i,:)); pause(0.5); % 暂停0.5s end